System Information
Use the System Information menu to get various information about the system.
Transaction Log
In the transaction log, all movements in the warehouse are registered, when the article has been moved, who has performed the action, which orders were underlying the movement etc. This is a very efficient problem resolution tool and is also very useful in compiling statistics. Every single operation where goods are stored or picked in the machines are stored in the Transaction Log. The log is the list of all performed operations and will documents what have occurred.For all registrations also time is logged, the operator’s user name, location, items number, order number and quantity.
You can either to show all transactions or a search criteria can be specified, so that only the relevant transactions are displayed. Among the possible search criteria to view transactions for a certain time on a specific product or a specific operator.
Navigation
Keyboard: CTRL-L
Menu: System Information -> Transaction Log
Functions
The Transaction Log shows a variety of search criteria that can be used to select what you want to see, basically lists all the latest transactions.A maximum of 200 transactions are shown in one window. Once search criteria has been changed, press the Update (or press Enter) to reload the data from the database.
List of transactions are always sorted in chronological order (by time), with the youngest first.
Numbers are displayed as positive when they are inbound to the stored and negative when they are pulled out.
The following functions are available:
Start Date: The first date that appears.Note that if there are more than 200 transactions in the selected time interval, the End Date as applicable.
End Date: Last date for the selected transactions.The top transaction in the list will be the last one occurring before that date.
Box Number: If only the transactions in this box number.
Location Address: If only transactions for this address.
Type of transaction: If only the transactions of this type.What transactions are available may vary. Select All to check all transaction types.
User: If only the transactions of a particular user.
Order Number: If only the operations of this order.
Article Number: If only the transactions for this article.
Update: Updates the contents of the table.Note that it may take some time for some questions - there can be many transactions to search through! “Enter” key also acts as Update.
[Export]: Allows you to save the displayed transactions in a file as text or Excel format.
[Clear]: Resets all search fields to their default value.
[Down arrow]: In the lower left corner is an arrow.The move date range as the last date will be set to the bottom line. This feature can be used to display earlier transactions than currently shown, a way to go back in the history of.
Search with “%” and several fields
If you want to search only a specific part of a number / name, you can use “%” for the part to be ignored. For example, 2004% select all orders that begin with 2004 and% 404% select all orders where “404” is part of the number. “%” Can be used for all text search box.
Completed more than one field as search criteria, only those transactions where all criteria are met.
Using the quick functions with the mouse
Some frequently used functions are accessible by right clicking the mouse on a particular line. The following menu is displayed as:
The functions are:
-
Open article editor: Open artikle editor with the artikle is on the selected transaction.
-
Open orders Editor: Open artikle editor of the order of the selected transaction.
-
View only this Part: Put the item number of the selected transaction as search criteria and update the table.
-
View only this order: Put the order number of the selected transaction as search criteria and update the table.
-
View only this location: Set location address of the selected transaction as search criteria and update the table.
-
See all: Remove all the search criteria, the dates will not be changed.
System Log
The System Log displays information about error messages, import of host orders and other information relevant to the servicing and maintenance and an important tool to pinpoint problems. The System Log does not contain information about changes in the inventory, this is covered by the Transaction Log.
Navigation
Menu: System Information -> System Log.
Short-Cut: CTRL+Y
Functions
The log is shown in chronological order with the last entry at top.
It is possibly to filter the log, so only a specific time internal is shown, only logs generated by some modules or narrow by some specific error codes.
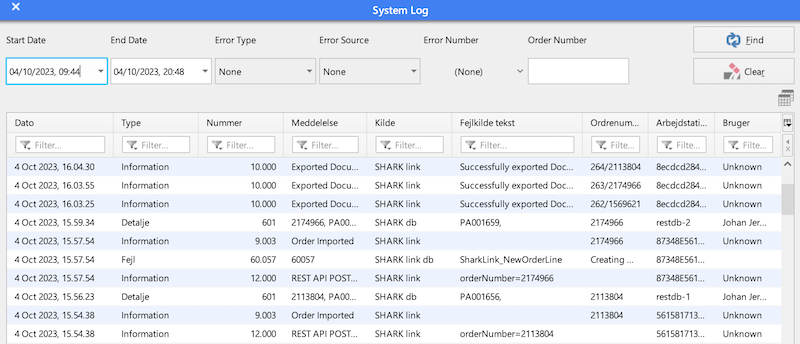
For each logged line the following information is available:
| Column | Description |
|---|---|
| Date | The date and time for the event |
| Type | Error type: Error/Warnings/Info/Detaild |
| Number | The error number. Many of the error codes are defined here. |
| Message | Short description of the event |
| Source | Who made the event log. Shark APP:The PC Client, Shark Link DB: Integration to external systems logged from the database, Shark Control: Hardware related, Shark Link:Integration to other systems, Shark DB:Database related. |
| Error Message | Detailed message. Double click the row to show in a separated window |
| Order Number | Typical an order number, but may contain other information usefull for the message |
| Workstation | Name of PC/PDA or workstation from where the log was generated |
| User | Current logged in user for the workstation |
At the top some filter functions are available:
- Use Start/End Date to specify a certain time range. Since the log window only shows a limited number of rows, it might be required to define a time range, to look for older events.
- Error Type
- Source
- Error Number (if known).
- Order Number: To look for a specific order/document or other.
Some filter examples:
- Set Error Number to 11000 to show all restarts of the SHARK Scheduler.
- Set Type to “Errors” and Source to “SHARK Link” to errors related to Host Integrations.
Choose also to view all types of messages or only errors:
As standard the System Log will keep the last 250,000 entries, if the log contains more, they will be cleaned up.
Box Statistics
There is an ongoing need to monitor how the available location types are used. The box statistic provides a list over which location types have been created, in which zones they are used and how many are in use and free. Moreover the free and used space and area are calculated.
Navigation
Menu: System Information -> Box Statistcs.
Short-cut: No
Functions
Shows a table over used and free locations group by location types. Moreover it is possible to show all zones and one specific zone. The bottom line is a sum of all available types. So for example if the the [Zone] drop down box is set to “All Zones”, the bottom line shows the total available number of locations, free and occupied for the current site.
Please note that a location is occupied, if an article is assigned the location, the statistic does not taking into account, if the locations are full or just partly used.
Zone: Choose here between óne zone or all.
Stock Report
A simple report showing the complete stock.
Order Statistics
The Order Statistic function is used to see information about the picking rate. For example, how long does it take for the warehouse from an order is received until it actually is picked. It is an effective tool to monitor if the warehouse is working satisfactory and how changes influences on the output. Statistical tools are important for the ongoing optimization of warehouse operations. It is for instance possible to see:
- Picking frequency divided up into zones/users/order types and time intervals.
- Order lead times.
- Picking frequency for trays in vertical lifts.
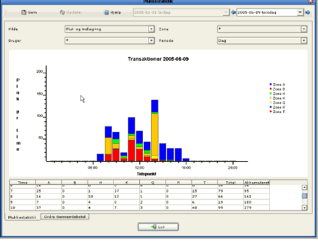
Here is the number of transactions divided up into how many per hour for one day. The best utilization of the warehouse is achieved by operating at full capacity for as short a time as possible.
Warning!
Some of these statistical calculations are very demanding and can load the database seriously. Therefore, avoid prolonged use of statistical functions when SHARK is in normal operation, since it could potentially cause longer response times for users.
Navigation
Menu: System Information > Picking Statistics > Order turnaround (tab).
Shortcut: No
Functions
In the upper part of panel select the data to be displayed and how.
Date from: Only orders completed >after that date are included.
Data: Only orders completed before that date included.
Source: Choose here whether to display pick orders put-away orders, etc.
Order Form: Select the specific type of order to be displayed.
Display Type: Select whether to display a histogram or a general average.
when the setup is changed. Updates the panel even after approx. 5 seconds if there is pressure within.
Functions (Histogram)
Histograms show the selected orders in the graph and the table and read as:
-
The blue bars are the number of orders that are completed at the given time.If, for example, the resolution is “day”, every column displayed are the orders for the current day. The number of the orders shows on the left y-axis. For example will the column for “5 days” to show how many orders were completed within 5 days.
-
The black graph shows the summed number converted to percent.Used to see how many orders were completed within a given time. Percent is on the right y-axis. Example, if you want to see how long it takes before 60% of orders are completed you can read the summed graph out for 60% (approximately 5 days).
The same information as the graphs shown can also be seen in the table.
You receive up to a maximum of 100 hours or 100 days, so in some cases, the accumulated numbers do not reach 100% (if there are orders that have been more than 100 days on the way).
Features: Average
The average is calculated as a standard average over the specified period (start and end date).
- The blue boxes show the number of orders for that period, the number shown on the left graph.
- The black graph shows the average number of days for the order and read on the right graph.
- The gray graph is a trend or tendency graph showing the trend over the period in question, read on the right graph (calculated as least-mean-square of the average).